Strategic Voter Simulations
John Huang, 2 February 2021
Executive Summary
This report documents results for strategic voting simulations for a variety of proposed and popular voting methods. Assessed systems include:
These new systems are compared to the traditional plurality voting system.
Simulation output is shown below for 3 voter strategies - honest, one-sided, and two-sided strategy. Voter Satisfaction Efficiency (VSE) is plotted for simulated elections at the 5th percentile of lowest VSE, the 95th percentile of highest VSE, and the average VSE.
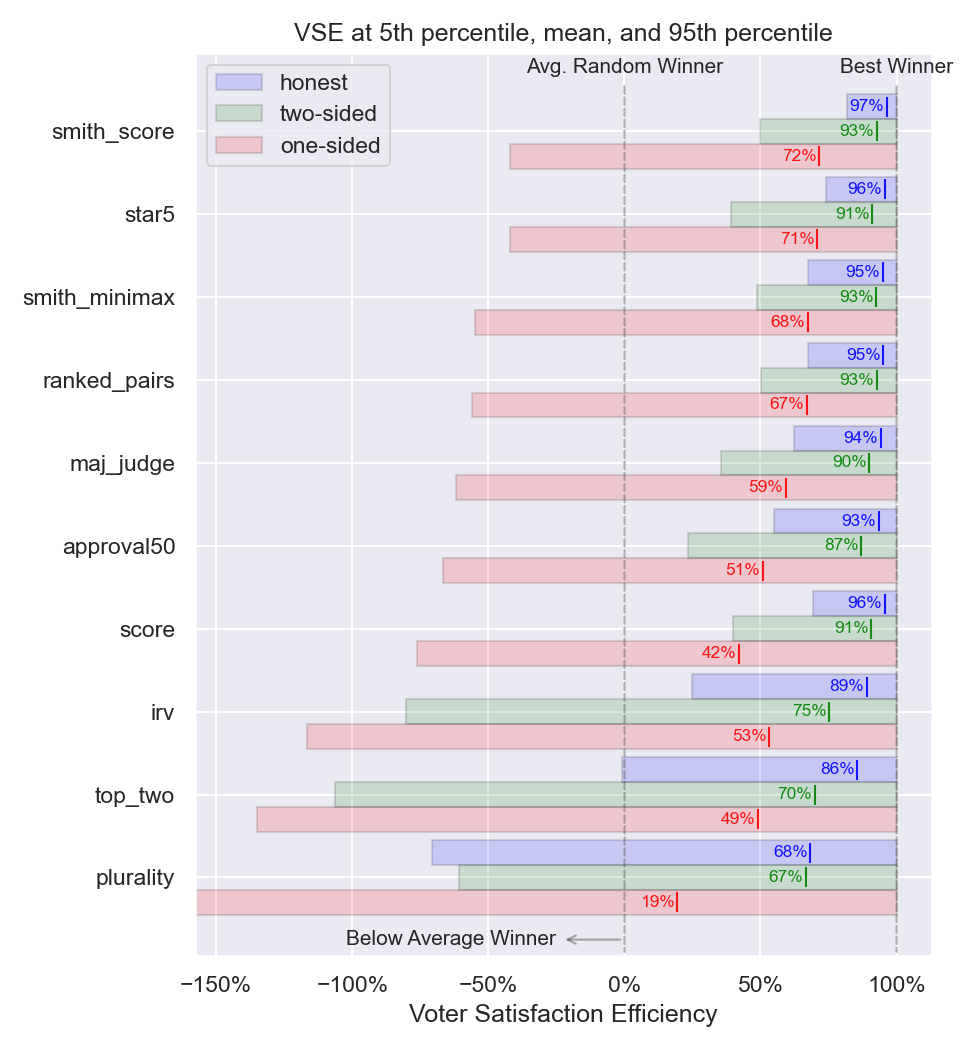
Figure 1: Voter satisfaction efficiency for honest, one-sided, and two-sided strategy
Results suggest that Condorcet methods and STAR voting are highly resistant to strategy compared to other voting methods.
Strategy Model
Voter strategy was devised upon predicting a winner by simulating an honest election, and then performing coordinated voting ballot tactics on an “underdog” candidate in an effort for the underdog candidate to win against the “topdog” honest winner.
Honest Strategy
An honest strategy in this simulation is defined to be a voter behavior where scores or ranks are constructed monotonically and proportionately to voter preference distance from a candidate. Honest strategy produces an “honest winner”.
Front-Runners
Two candidates are chosen by voters to apply strategy. The topdog front-runner is always the honest winner. The underdog front-runner is chosen iteratively, however strategic voters will always coordinate their votes in favor of this arbitrary front-runner.
Tactics
Tactics are ballot manipulation routines voters may use to boost support for their preferred candidate.
Bury – Rate or rank a front-runner the worst rank or rating equal to a voter’s true most hated candidate.
Deep Bury – Rank a front-runner the worst rank, below a voter’s true most hated candidate.
Compromise – Give a front-runner the best rank or rating.
Truncate Hated – All candidates equal or worse than the voter’s hated front-runner are given the lowest ranking or score.
Truncate Preferred – All candidates worse than the voter’s favorite front-runner are given the lowest ranking or score.
Bullet Preferred – The preferred front-runner is given the best score or rank. All other candidates are given the lowest rank/score.
Minmax Hated – Give worst rating or ranking to candidates equal or worse than a voter’s hated front-runner.
Minmax Preferred – Give worst rating or ranking to candidates worse than a voter’s favorite front-runner.
One-Sided Strategy
One sided strategy is defined to be a strategy where only supporters of an underdog candidate use tactics, while topdog supporters use honest strategy.
The goal of the assessment is calculate potential worst-case tactical scenarios, assuming rational underdog voters with perfect information. Given the enormous space of possible voter behavior, simulation post-processing chooses a one-sided tactic that must increase the satisfaction of underdog strategic voters but also minimize average voter satisfaction. Tactics are iterated over all possible underdog candidates and test against all possible underdog-against-topdog voting coalitions. Every listed tactic is iteratively tested. All underdog coalition members use the same tactic, though their ballot markings may still be different from one-another.
If all tactics backfire against the underdog (ie, result in reduced satisfaction for all underdog coalitions), then the honest election results are used. In other words, this analysis assumes that one-sided strategic voters are rational enough to avoid backfire.
Two-Sided Strategy
In two-sided strategy, underdog voters use the same strategy as in one-sided strategy. Topdog coalition members attempt to counter underdog strategy by bullet voting in favor of the honest winner.
In contrast to one-sided strategy, two-sided simulations do not filter out backfired two-sided tactics. Two-sided strategy tests a voting method’s ability to resist any sort of underdog manipulation.
For the scope of this assessment, no other topdog counter strategies were considered.
Simulation Details
6000 total voter/candidate distribution combinations were simulated.
There are 51 voters for each election.
Spatial preference dimensions of 1, 2, and 3 were used.
Voter preferences are normally distributed.
Candidate preferences are uniformly distributed +/-1.5 std deviations from the voter preference mean.
There are either 3 or 5 candidates in each election.
Example Election
To illustrate the mechanics of tactical voting, a simple first-past-the-post plurality election’s results are presented in this section. This election was performed with 201 voters and 5 candidates. The results of an honest election are plotted in Figure 2. Candidate and voters are plotted in their 2-dimensional preference space. Candidates are denoted as stars, and voters are denoted as circles. Each of the 5 candidates is denoted Red, Blue, Green, Yellow, and Cyan.
In the honest election, the Blue candidate wins by plurality with 68 votes, or 34% of total votes. An honest election also results in a VSE of 0.83.
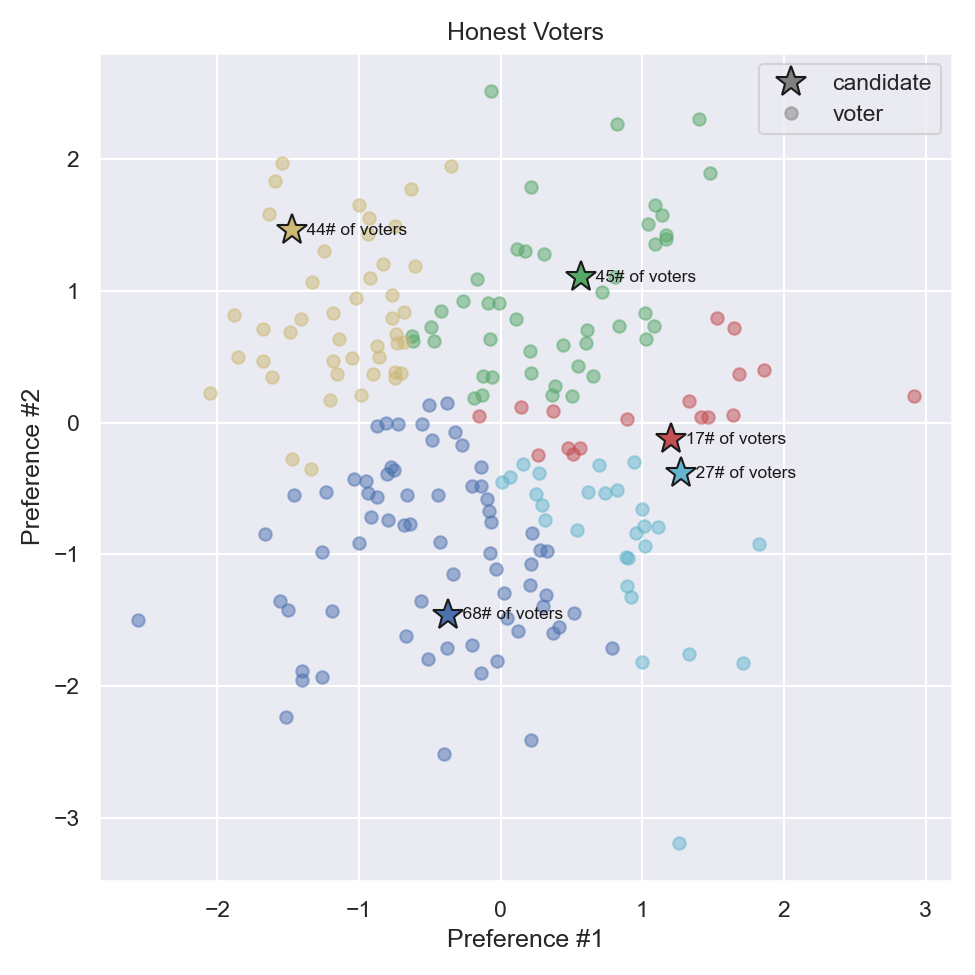
Figure 2: Voters and candidate preferences, assuming honest behavior
Clearly it is possible to form a coalition to defeat blue, yet which candidate should lead the charge? The next two Figures 3 and 4 propose a challenger coalition and observe the results.
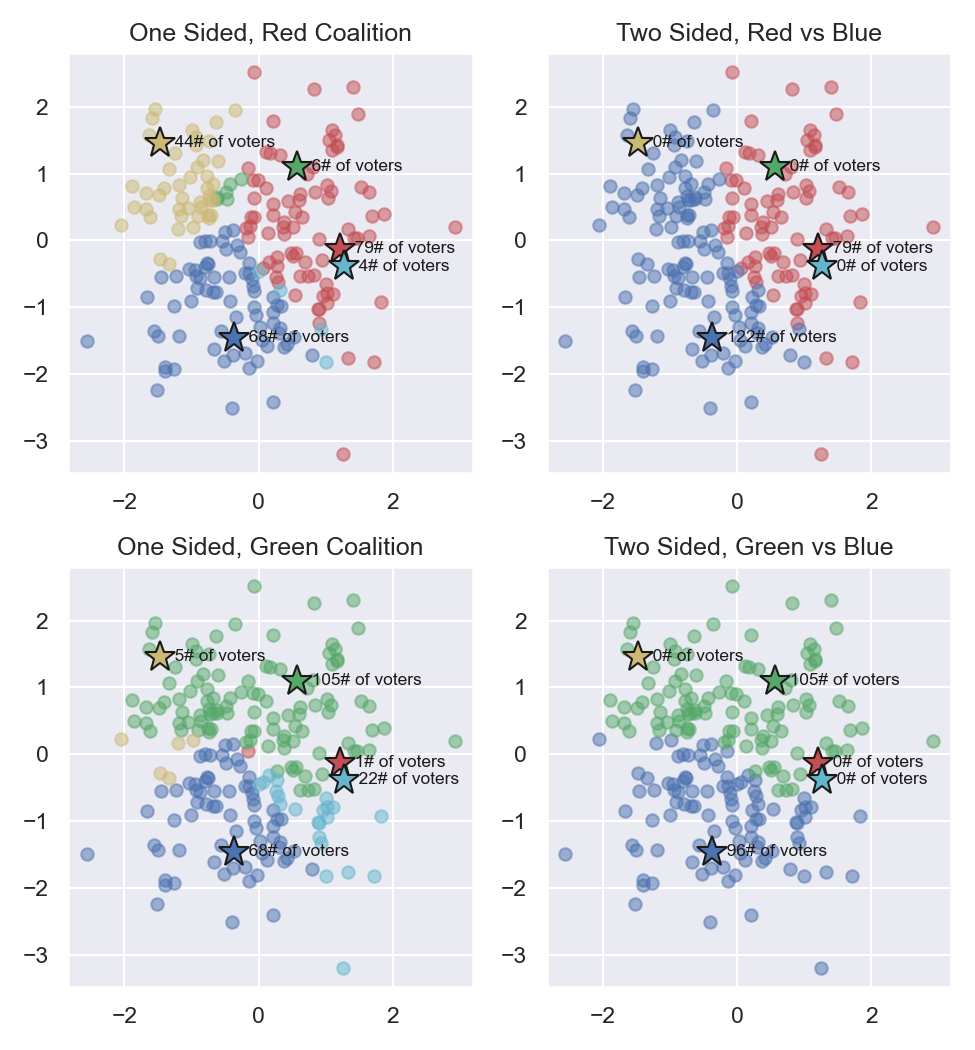
Figure 3: Voter tactical preferences assuming a Red or Green candidate underdog coalition
In Figure 3 on the top row, a one-sided Red Coalition is capable of defeating Blue by 79 to 68 votes. In this strategy, the Red coalition decides to ignore Yellow, Green, and Cyan candidates. Non-coalition members that otherwise would support blue have wasted 44 votes on Yellow, 6 votes on Green, and 4 votes on Cyan. This election would result in 0.89 VSE which improves the results of an honest election. However in a two-sided struggle where a Blue Coalition is constructed, the Blue coalition can amass 122 to 79 votes, resulting in a Blue winner.
Figure 3 on the bottom row shows a potential coalition with Green candidate. In a one sided election, Green is capable of amassing 105 votes vs 68 votes for Blue. Moreover, even if Blue constructs their own coalition in a two-sided strategy, Green still wins with 105 against 96 votes. The Green-led coalition would result in a VSE of 1.00 which is the optimal result.

Figure 4: Voter tactical preferences assuming a Yellow or Cyan candidate underdog coalition
Figure 4 presents the potential coalitions for Yellow or Cyan candidates. Notably, it is possible for Yellow to defeat Blue 80 to 68 if a one-sided strategy is used. Such a combination results in the worst VSE of -3.09. It is also possible for Cyan to defeat Blue in a one-sided election by 77 to 68 votes with a resulting VSE of 0.36. However in both of these elections, a two-sided Blue strategy can resist these challenges to maintain a VSE of 0.83.
This simulator is interested in recording the worst case tactical results of an election. In our example, all four underdog candidates are capable of challenging and defeating the topdog honest winner in a one-sided strategy. The worst case scenario is a Yellow victory; therefore the one-sided VSE recorded for this election is -3.09.
One underdog candidate is capable of defeating the topdog honest winner in a two-sided strategy. The worst case scenario for this election however is coalition formation by the losing underdog candidates. Therefore a two-sided VSE of 0.83 is recorded for this election.
Results
A simple performance metric is devised as the average of honest, 1-sided- and 2-sided VSE. The results are shown below:
Election Method |
Average VSE |
|---|---|
plurality |
0.515 |
top_two |
0.683 |
irv |
0.725 |
score |
0.762 |
approval50 |
0.772 |
maj_judge |
0.812 |
ranked_pairs |
0.849 |
smith_minimax |
0.850 |
star5 |
0.858 |
smith_score |
0.870 |
Results show that Condorcet systems such as ranked_pairs, smith_minimax, and smith_score are excellent performers. STAR voting is also a top performing system. The worst performing systems are plurality, top-two, and instant-runoff (IRV).