Simple 3-Way Election Simulations for Alternative Voting Methods
John Huang, 16 May 2020
This report seeks to help answer the question, “What is the best voting system?” To that end, this report documents results from 3-way election simulations on a 1-dimensional spatial model with 3 competing candidates.
The objective of these simulations is to evaluate the effectiveness of proposed voting systems such as
These new systems are compared to the traditional plurality voting system.
From these simulations we can draw the following conclusions:
Plurality voting has terrible performance for any scenario where a majority winner cannot be found.
Condorcet-compliant methods such as ranked pairs, smith-minimax, and Smith-Score (a score/condorcet hybrid) have typically excellent performance.
Instant Runoff (IRV) and Top-Two-Runoff have mediocre performance for scenarios where a majority winner cannot be found.
Cardinal systems such as approval and score have erratic performance and are highly dependent on the tactical behavior exhibited by voters. Bullet voting, over-approving, and under-approving, all may have positive and negative consequences to overall election satisfaction.
Cardinal systems sometimes fail to elect Majority-Utilitarian winners.
The STAR voting hybrid might mitigate some of the erratic performance of score voting and is a top performing system in our model.
From these results, we recommend modern, Condorcet-compliant systems such as Ranked Pairs as the optimal voting reform for single-winner elections.
The Election Model
A simple spatial voter preference model is used with the following features:
100 voters per election generated using a normal distribution
1-dimensional spatial voter preferences
3 candidates per election generated using a uniform distribution +/-1.5-std deviations from the voter preference mean.
10,000 random combinations of voters and candidates
Voters were assumed to be “honest” in that they vote monotonically in favor of their most-and-least preferred candidates
The probability distributions of the voters and candidates is visualized below.
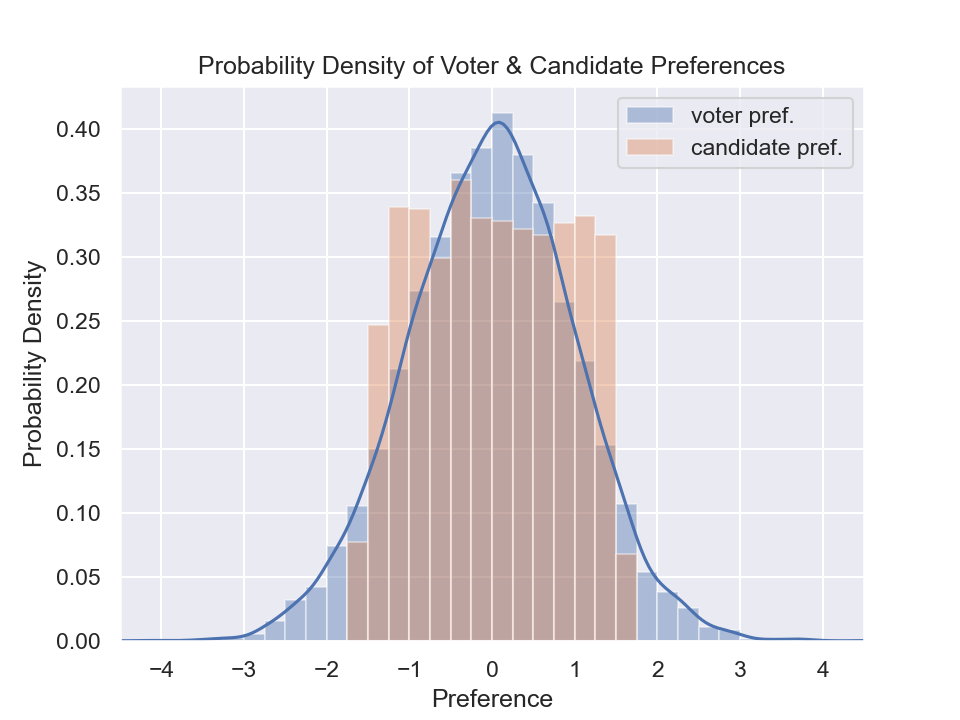
Figure 1: Probability of preferences (arbitrary units)
Election Parameters & Voter Behavior
For this suite of simulations, a single parameter - “Voter Tolerance” - was adjusted. This parameter controls the voter’s pickiness on whether or not s/he would cast a nonzero rating in favor of a candidate. If candidate preferences are within the voter’s preference tolerance circle, a positive score/rating would be marked, or the candidate would be ranked. If a candidate’s preferences lie outside the voter’s tolerance circle, the candidate would receive 0 rating/score and the candidate would not be ranked. The voter tolerance parameter has the same units as voter preference.
For scored elections, all voters normalize their score ballots. With 3 candidates, the least preferred candidate within the tolerance circle will always receive 0 score. The most preferred candidate will always receive a full 100% score. If no candidates lay within the tolerance circle, all candidates receive 0 score, no ranking, and a blank ballot.
Approval & Score Voting
This election simulator does not attempt to predict human behavior on how they would use approval voting. Cardinal systems, unlike ranked systems, require additional behavioral information on how voters would scale their score magnitudes. Our simulation models a simple linear mapping. However, approval voting results are also equivalent to a min-max strategy for score voting, and plurality voting is equivalent to a bullet voting strategy.
Because of the numerous strategies for scored & approval systems, approval voting is run 3 times with different voter tolerance thresholds.
Election Categorization
For each generated election, additional statistics classify each election on the existence & coincidence of:
Condorcet winner (The winner of all possible head-to-head matchups)
Majority winner (a candidate receiving greater than 50% of the votes)
Plurality winner (The candidate with the most first-preference votes)
Utility winner (The candidate that on average maximizes the satisfaction of voters)
These classifications and descriptions are shown in Figure 2 below.
In addition, a metric called the “Plurality Winner Ratio” (PWR) is proposed to help categorize elections. This metric retrieves the number of first-choice-votes cast for the plurality front-runner and compares it to the total votes cast. For elections with PWR greater than 50%, a majority winner exists. For elections with PWR less than 50%, no majority exists and the vote is split among the 3 candidates.
In our voter model, approximately 50% of generated elections had a majority winner. For 49.29% of elections, the majority winner coincided with the utility winner (labeled MU). In 15.85% of elections, no majority was found but the plurality, Condorcet, and utilitarian winner were coincidental. In 30.85% of elections, the plurality winner was not coincident with the Condorcet & utility winner. In 2.04% of scenarios, no Condorcet winner could be found. In 1.03% of scenarios, the majority winner did not coincide with the utility winner.
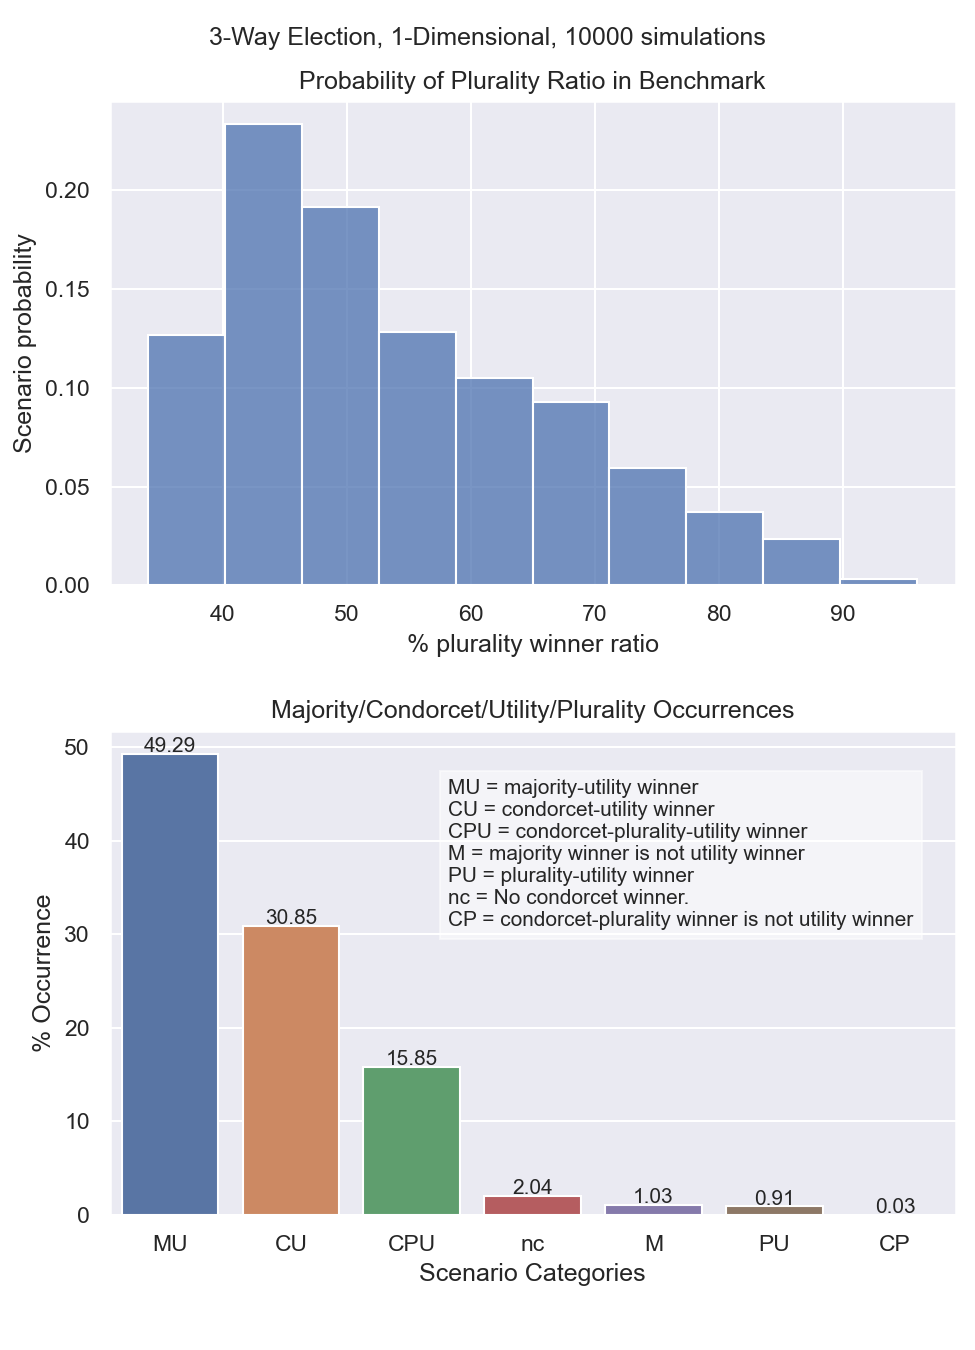
Figure 2: Scenario category probabilities for election model
Voting System Performance
This analysis assumes that the ideal candidate is the maximally satisfactory candidate by a utilitarian measure.
To evaluate utility maximization, the “Voter Regret” metric is proposed. “Voter Regret” is measured as the average preference distance between the most satisfactory candidate and the elected candidate. Voter regret is normalized by the distance between the the “ideal” centroid candidate and the average, random member of the population.
At 0% Regret, the best possible utilitarian candidate wins the election.
At 100% Regret, the regret of the elected candidate to the best candidate exceeds the average regret if a random voter was elected.
Voter Regret is plotted below with consideration for different PWR’s and election categories.
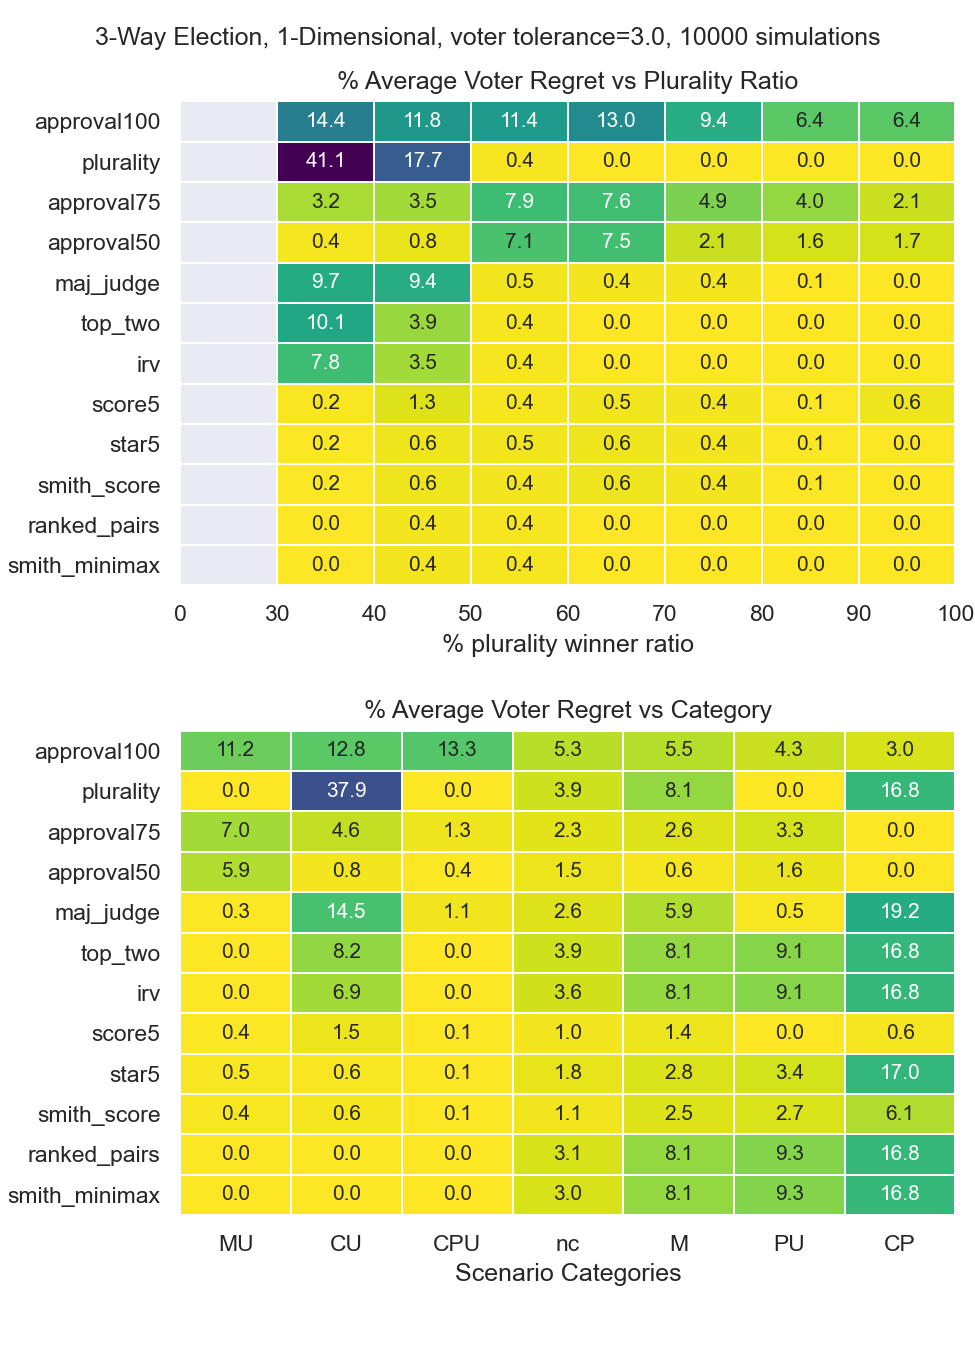
Figure 3: Voter Regrets
The following observations are made for various systems:
Plurality
Plurality voting has excellent performance for any election where a majority is obtained. However plurality will have terrible performance for any election where a candidate does not obtain a majority. For plurality ratios below 40%, plurality voting’s failure rate is several orders of magnitude greater than scored and Condorcet methods.
Instant Runoff
Instant runoff (IRV) and related method top-two runoff have mediocre performance for non-majority winning elections. However IRV & top-two are capable of reducing voter regret by several factors compared to plurality.
Cardinal Voting
It is possible for cardinal systems such as approval and score voting to fail to elect the majority-utilitarian winner. Cardinal systems seem to have a median candidate bias. This bias results in poor results when the median candidate position is far away from the voter preference centroid.
In addition, cardinal results, particularly with approval voting, are highly erratic. Depending on voter tactics, approval voting may sometimes yield the worst results of all methods, if voters “over-approve” and are too tolerant. Both over-tolerance and under-tolerance yield diminished voter satisfaction.
These assumptions highlight the tactical nature of cardinal systems, as there are many different ways to submit an “honest” ballot. Approval voting and plurality are both strategic subsets of score voting, and therefore the results from plurality and approval are also possible with score voting.
Scored systems do seem to have a small advantage in some scenarios, for example when a Condorcet winner cannot be found. Scored systems also do well for the small minority of cases when the majority winner is not coincident with the utilitarian winner.
Condorcet Utility
In our election model, the Condorcet winner is coincident with the utilitarian winner in 95.99% of simulations. Therefore Condorcet methods have excellent performance in this benchmark. Notably, Condorcet methods are able to choose the utility winner for the “CU” election category, which is the 2nd most common in our model. In comparison, plurality, instant-runoff (IRV), and top-two-runoff voting systems have greater difficulty handling the “CU” category due to center-squeeze failures.
Cardinal Hybrids
STAR and Smith-Score are cardinal voting hybrids. In STAR, a final runoff stage is used to select a majoritarian winner. In Smith-Score, the winner is chosen by calculating the Condorcet winner from scores. These systems are top performers in our election model. However their performance is contingent on the assumed voter strategy used in the simulation.
Effect of Voter Tolerance
Figure 3 plots high voter tolerance. The next plots re-examine the same elections when voter tolerance is diminished.
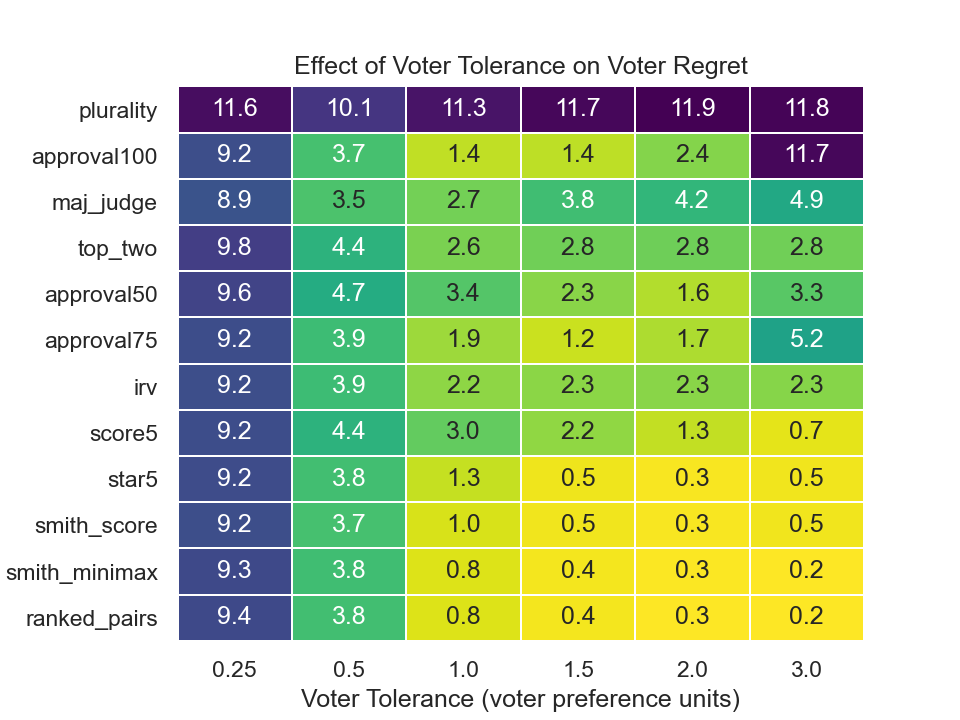
Figure 4: Regret vs tolerance
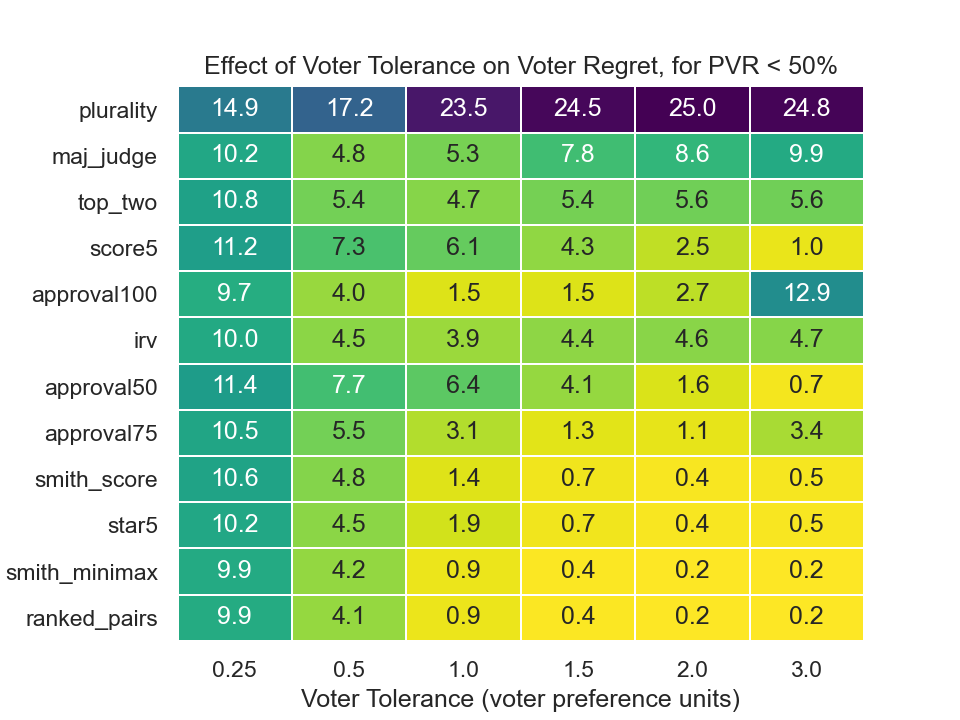
Figure 5: Regret vs tolerance when no majority winner exists
In general, reduced voter tolerance results in diminished utility for all voting systems, with the exception of approval voting & plurality voting. For approval voting, an ideal tolerance circle exists which maximizes utility; however if this ideal is not met, utility is diminished.
For elections where no majority is found, approval100 has the best performance of all systems. When a majority winner does exist, the performance of approval100 is the worst of all systems.
No systems seem to stand out in their ability to resist low voter tolerances.
Voter Satisfaction Efficiency
An alternative metric called voter satisfaction efficiency (VSE) has been previously proposed. This metric normalizes results by the average regret of the candidate population rather than the voter population.
With voter regret for some candidate combinations, regret will always be low because the candidates cannot be distinguished compared to the preferences of the voter population. However with VSE a candidate can always be elected with less than 0% VSE efficiency.
Results are also plotted by the reverse of VSE, voter dissatisfaction efficiency = VDE = 1 - VSE.
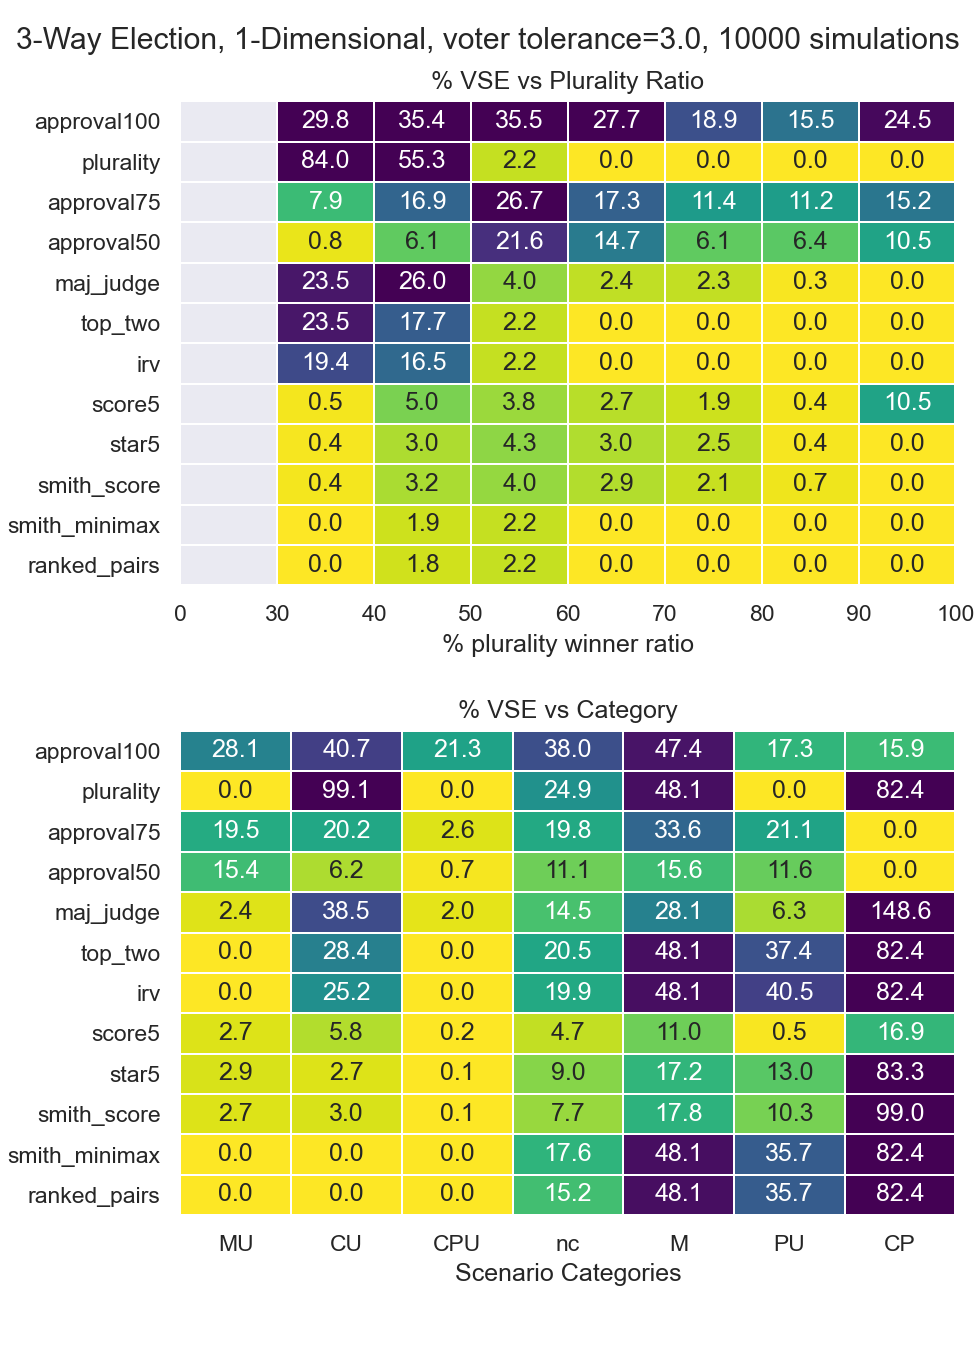
Figure 5: Voter Dissatisfaction Efficiency (1 - VSE)